
US Surface Imports First Quarter 2017
 Views: 1830
  Likes: 278
When it comes to U.S. imports of dimensional surfaces two numbers draw the big interest: the change in shipments for granite and quartz slabs. And, with the data, it's still an up-and-down world.
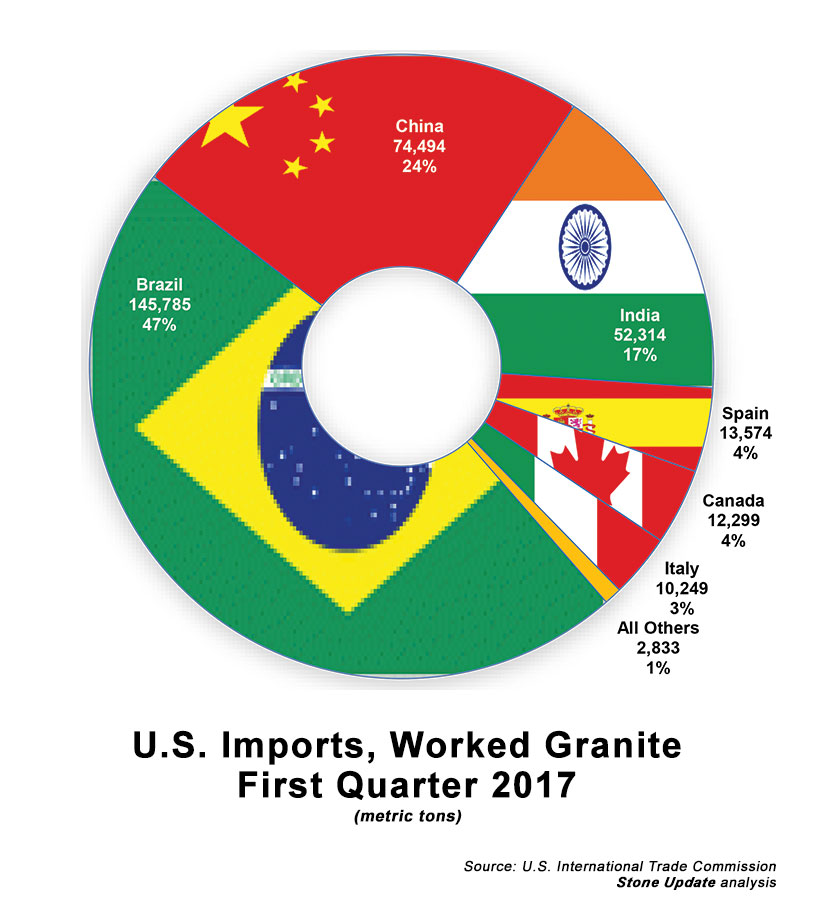
Imports of 'worked' (cut, one side polished) granite in 1Q 2017 trailed the same time last year by 10.7 at 348,458 metric tons. Considering that shipments in January-February this year totaled 9.7 less than the first two months of 2016, the numbers aren't heading off the cliff.
Brazil nearly mirrored the overall drop in U.S.-bound granite with a 1Q 2017 decline of 10.6, but the big drag came from China. its total of 74,494 metric tons for the first three months of this year represented a 27.8 drop from 1Q 2016.
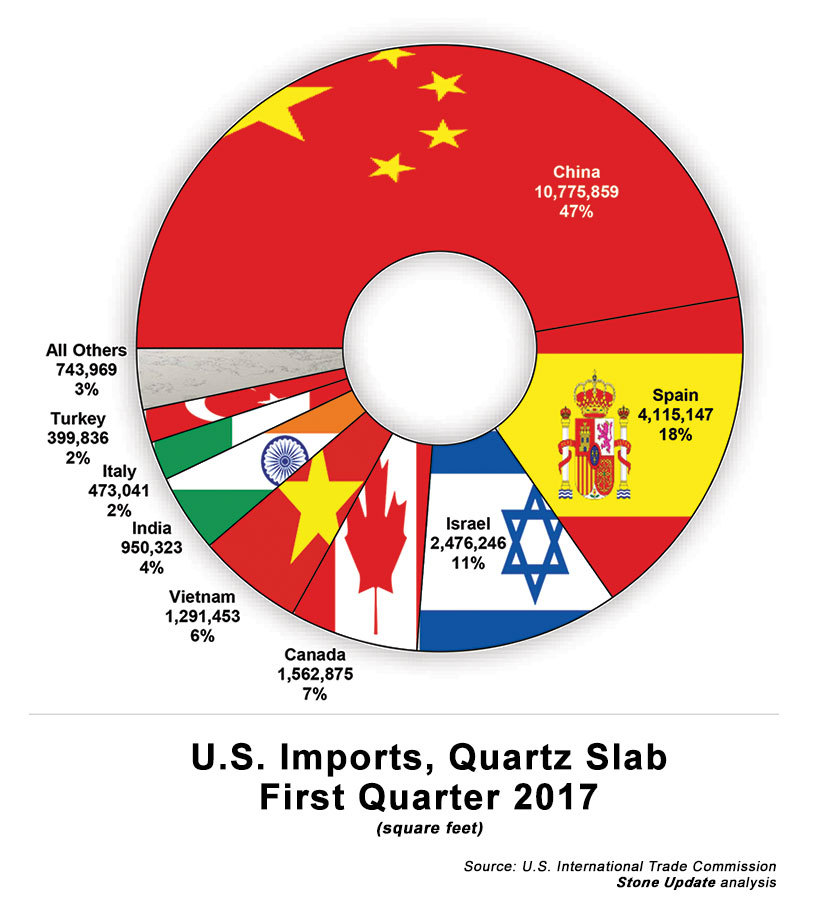
Quartz-slab imports went the other way in this year's first quarter, with a 26.6 gain from 2016. China kept container cranes busy by increasing its U.S. shipments by 66.9. Spain (21.4) and Vietnam (12.8) also pushed double-digit gains, while India declined by 17.6 in 1Q 2017.
The other big player - Israel - only marked a 2.8 increase, while Canada's quartz-slab shipments registered neither a net gain or loss (0). However, it's worth noting that U.S.-based factories for several companies are increasing domestic production and likely reducing the need for imported material.
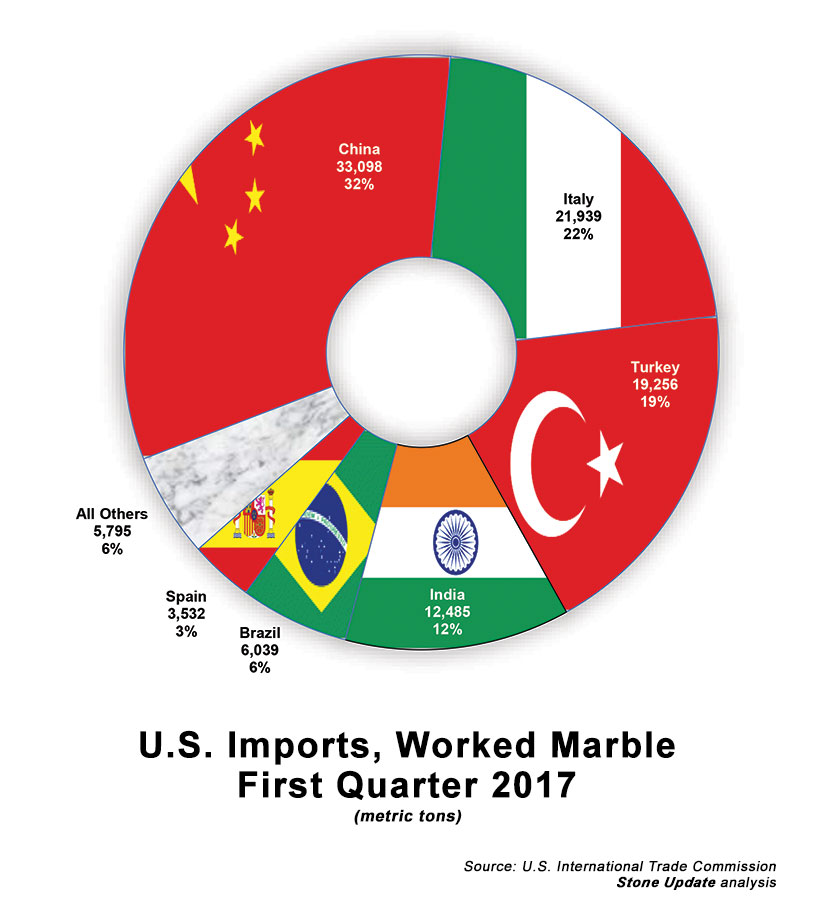
Worked marble also remained strong throughout this year's first quarter, with a 16.2 increase from the same time last year. Italy showed a rare downturn by dropping 8.8 from 1Q 2016 levels, but China took up the slack (and the #1 marble-import position) by sending 44.1 more marble to the United States. Turkey (13.4) and India (40.5) also offered impressive gains.

Keywords: StoneADD Articles

